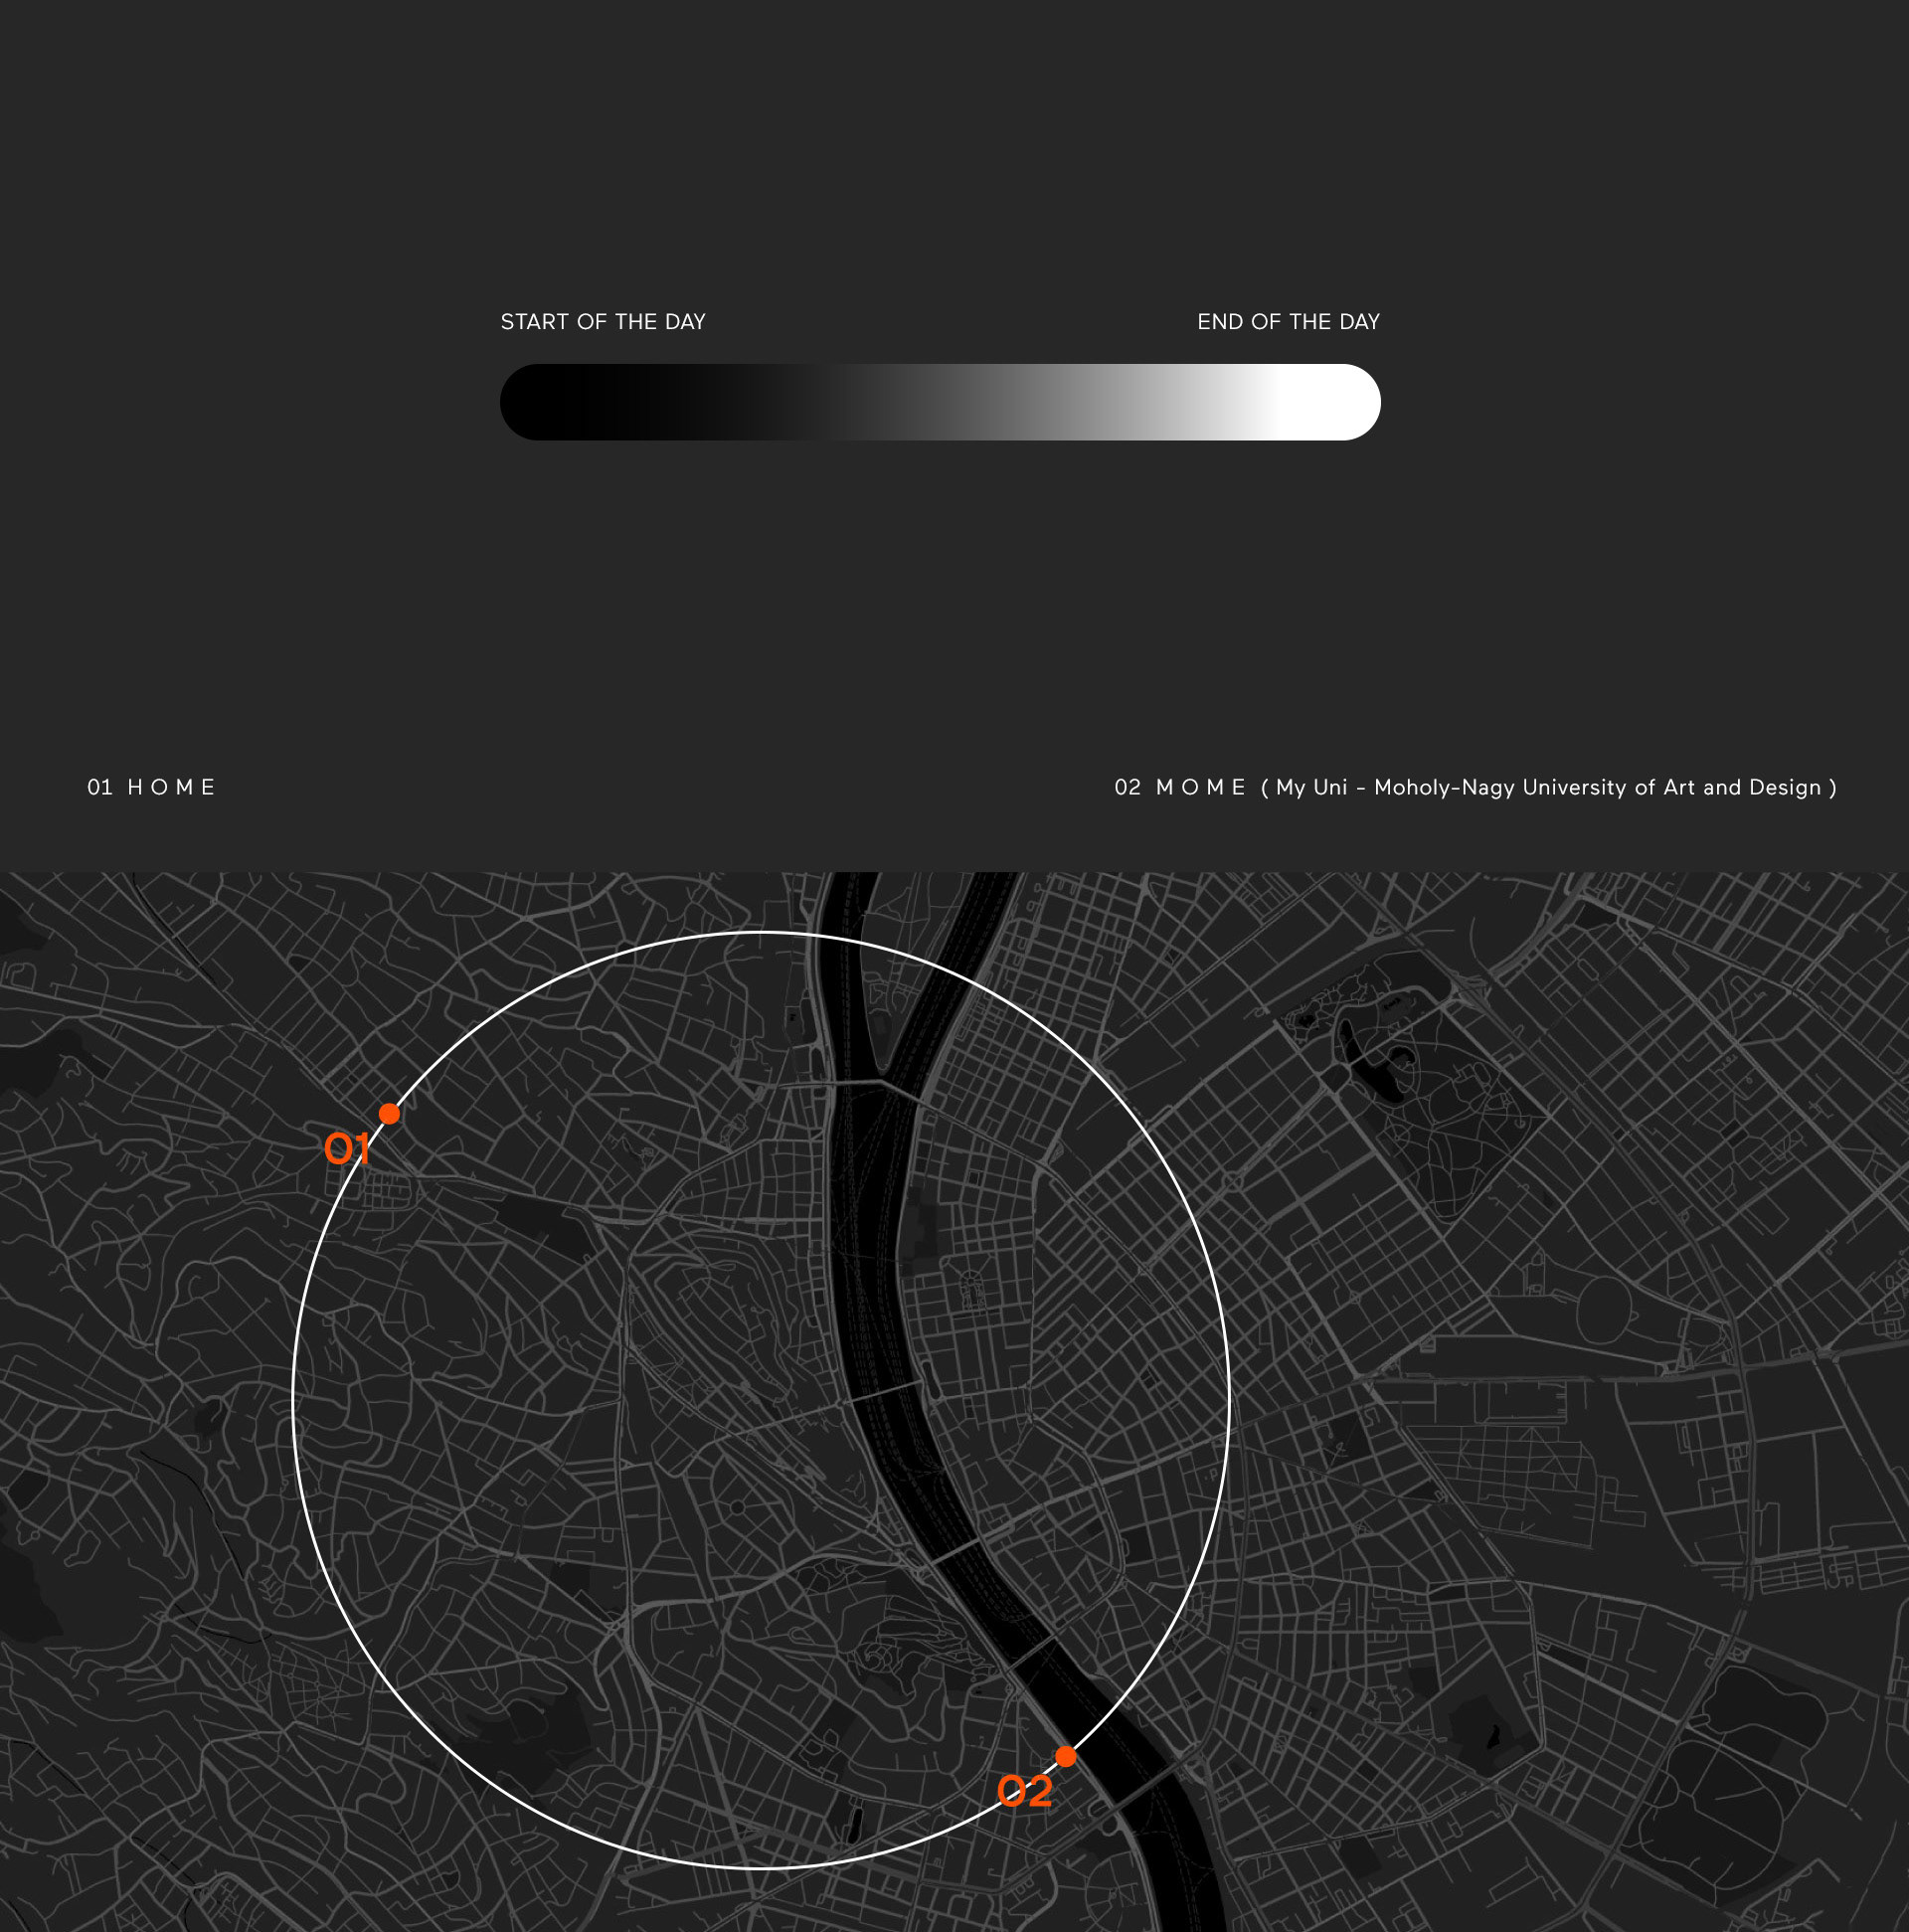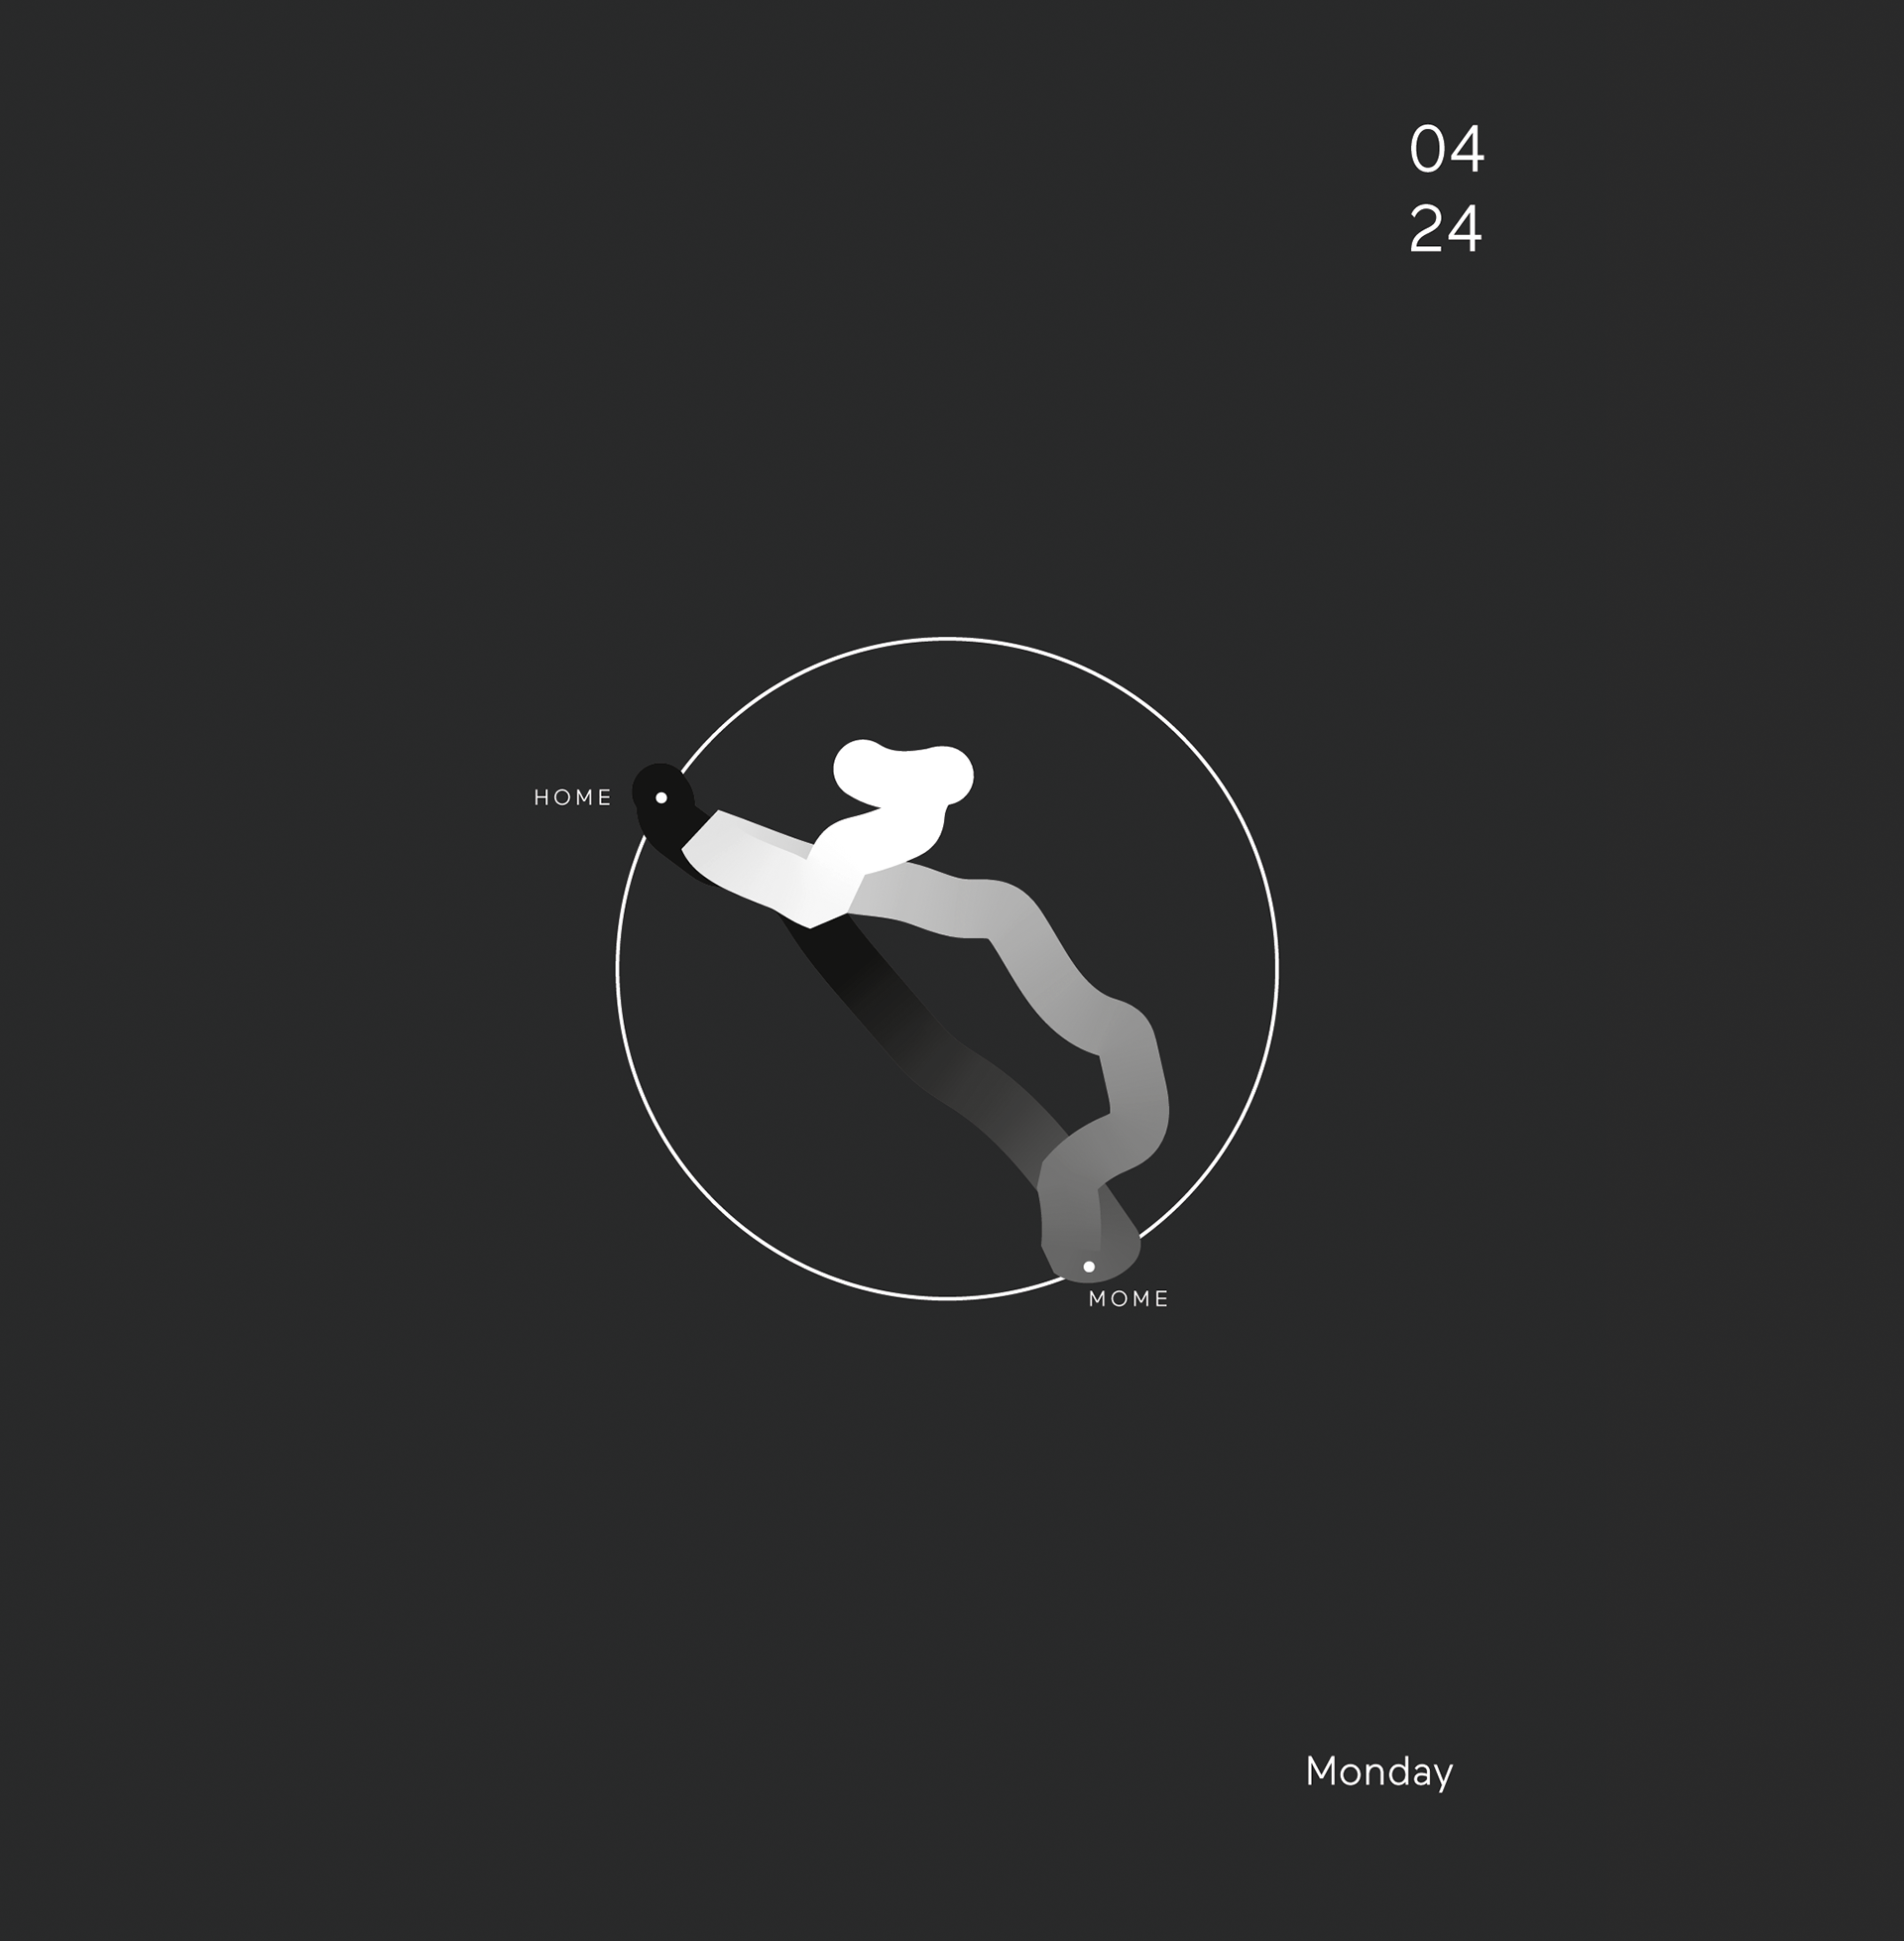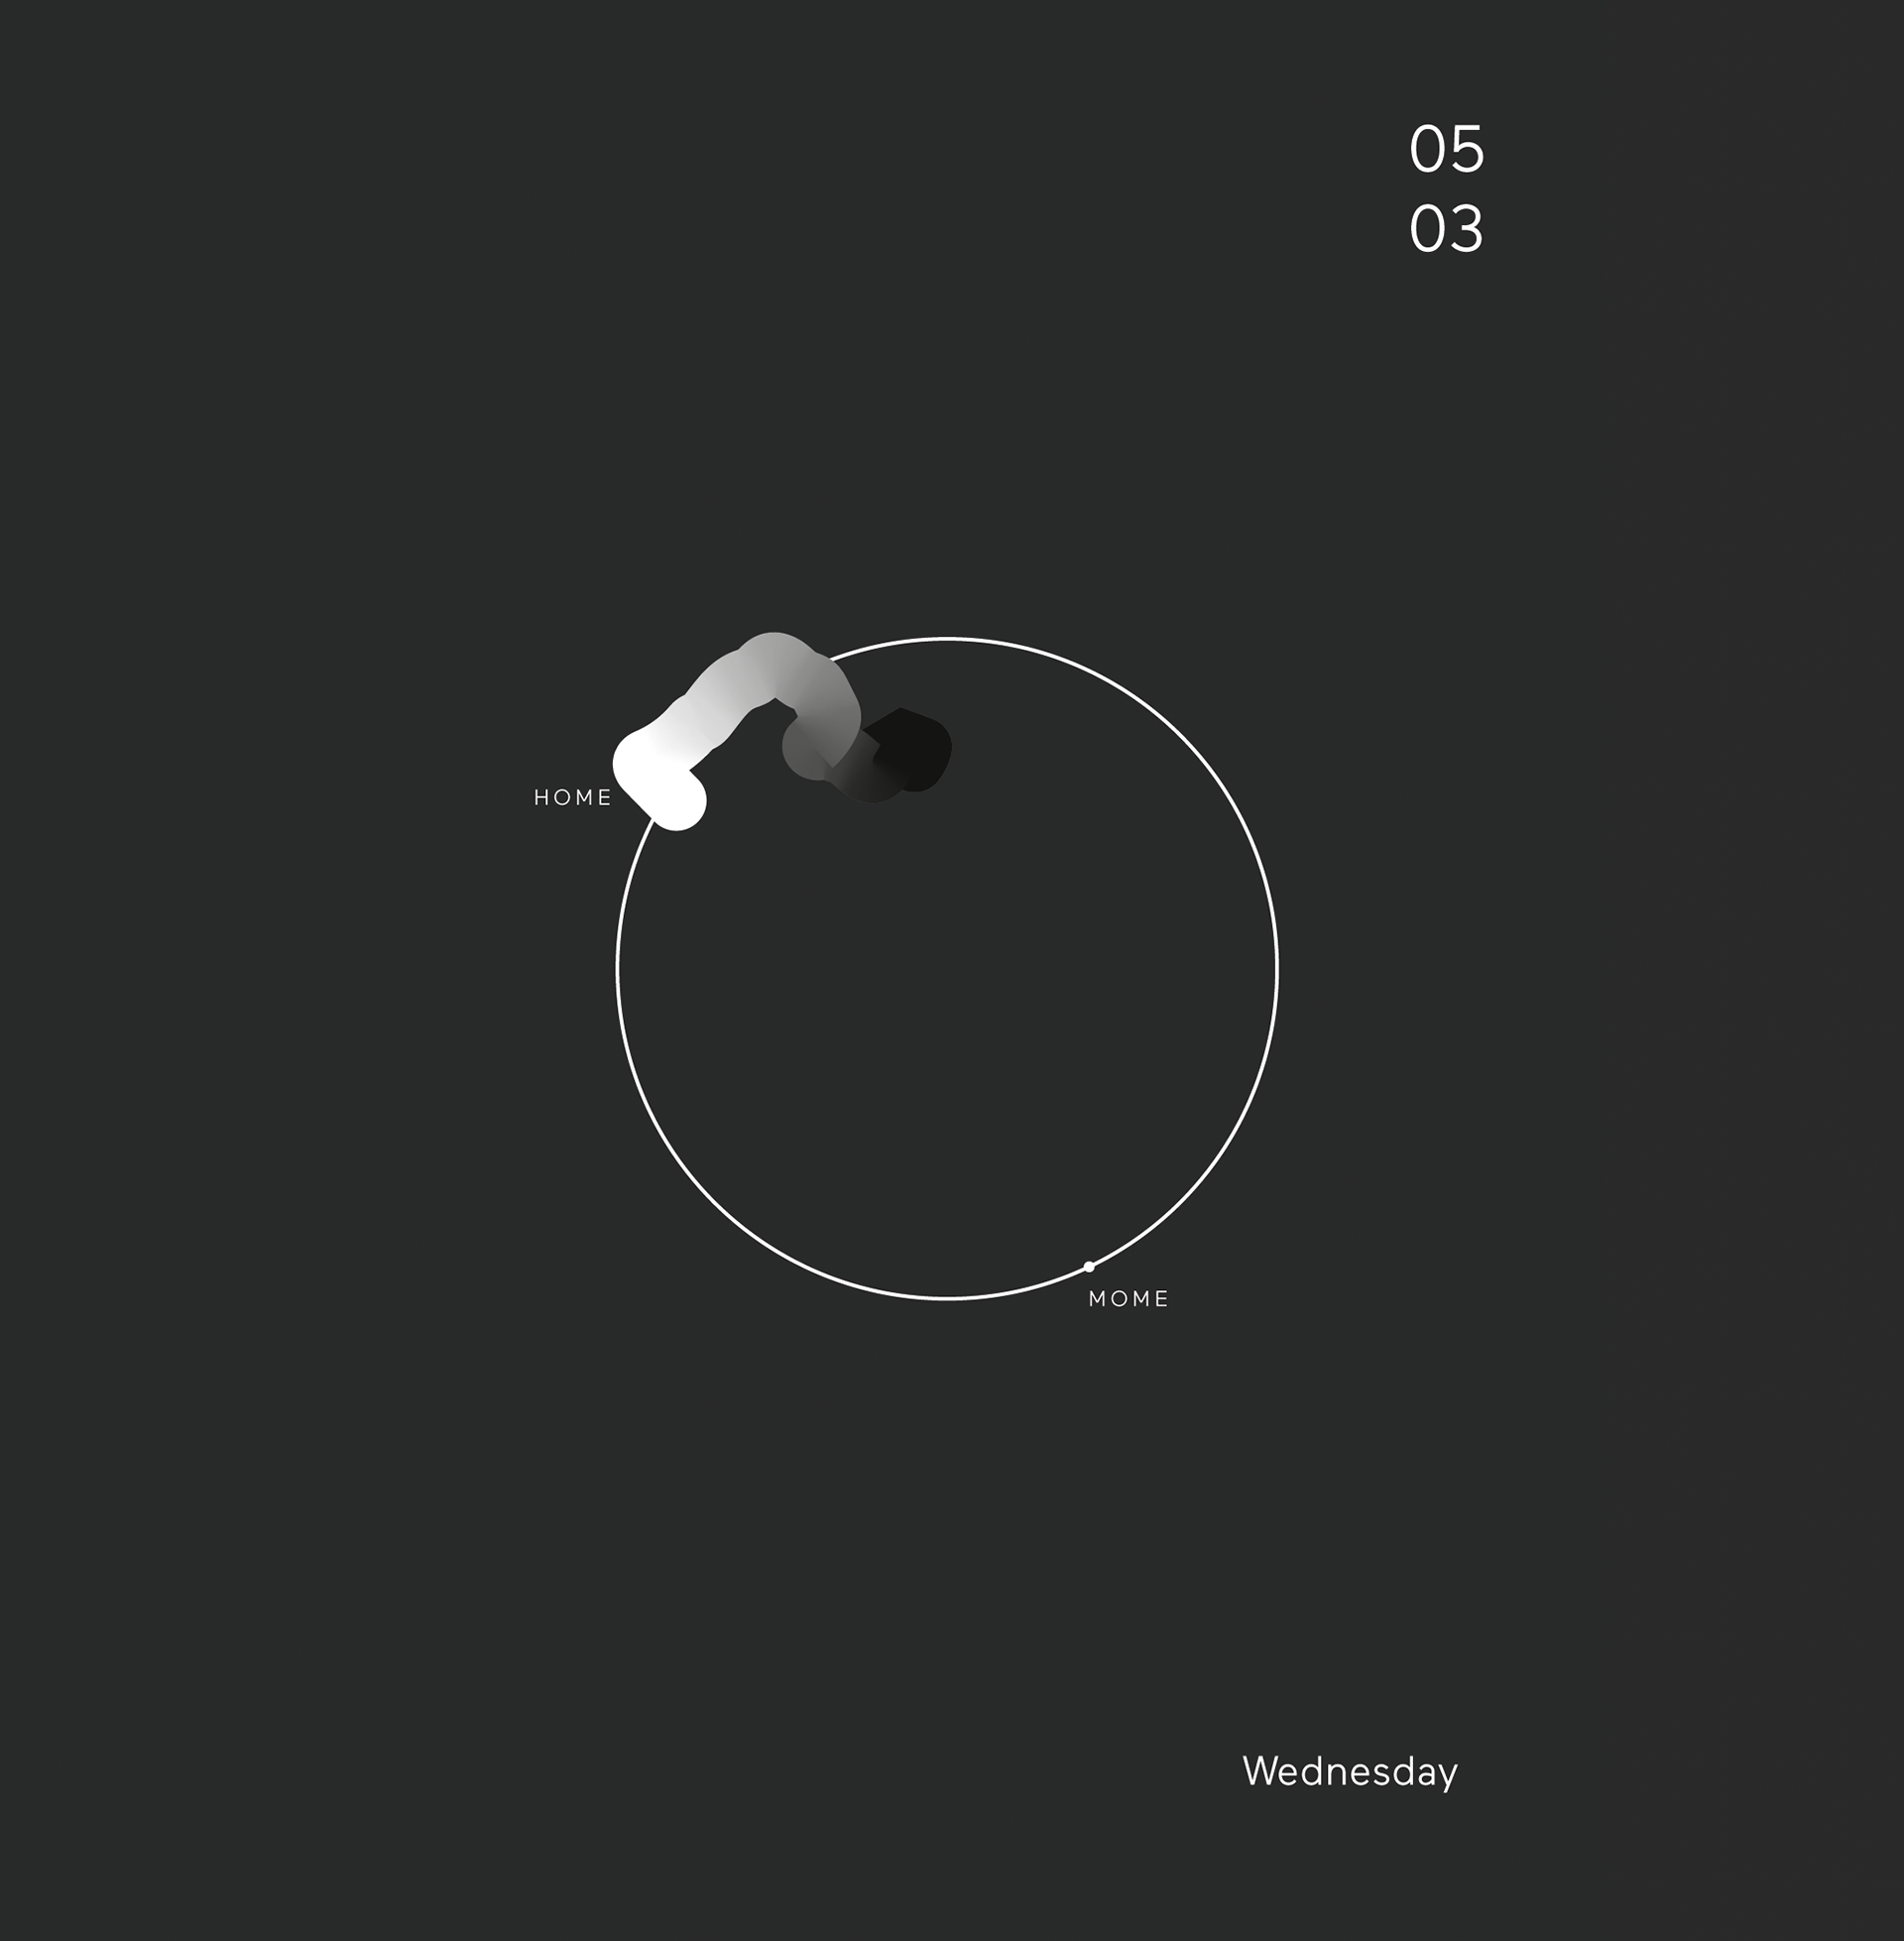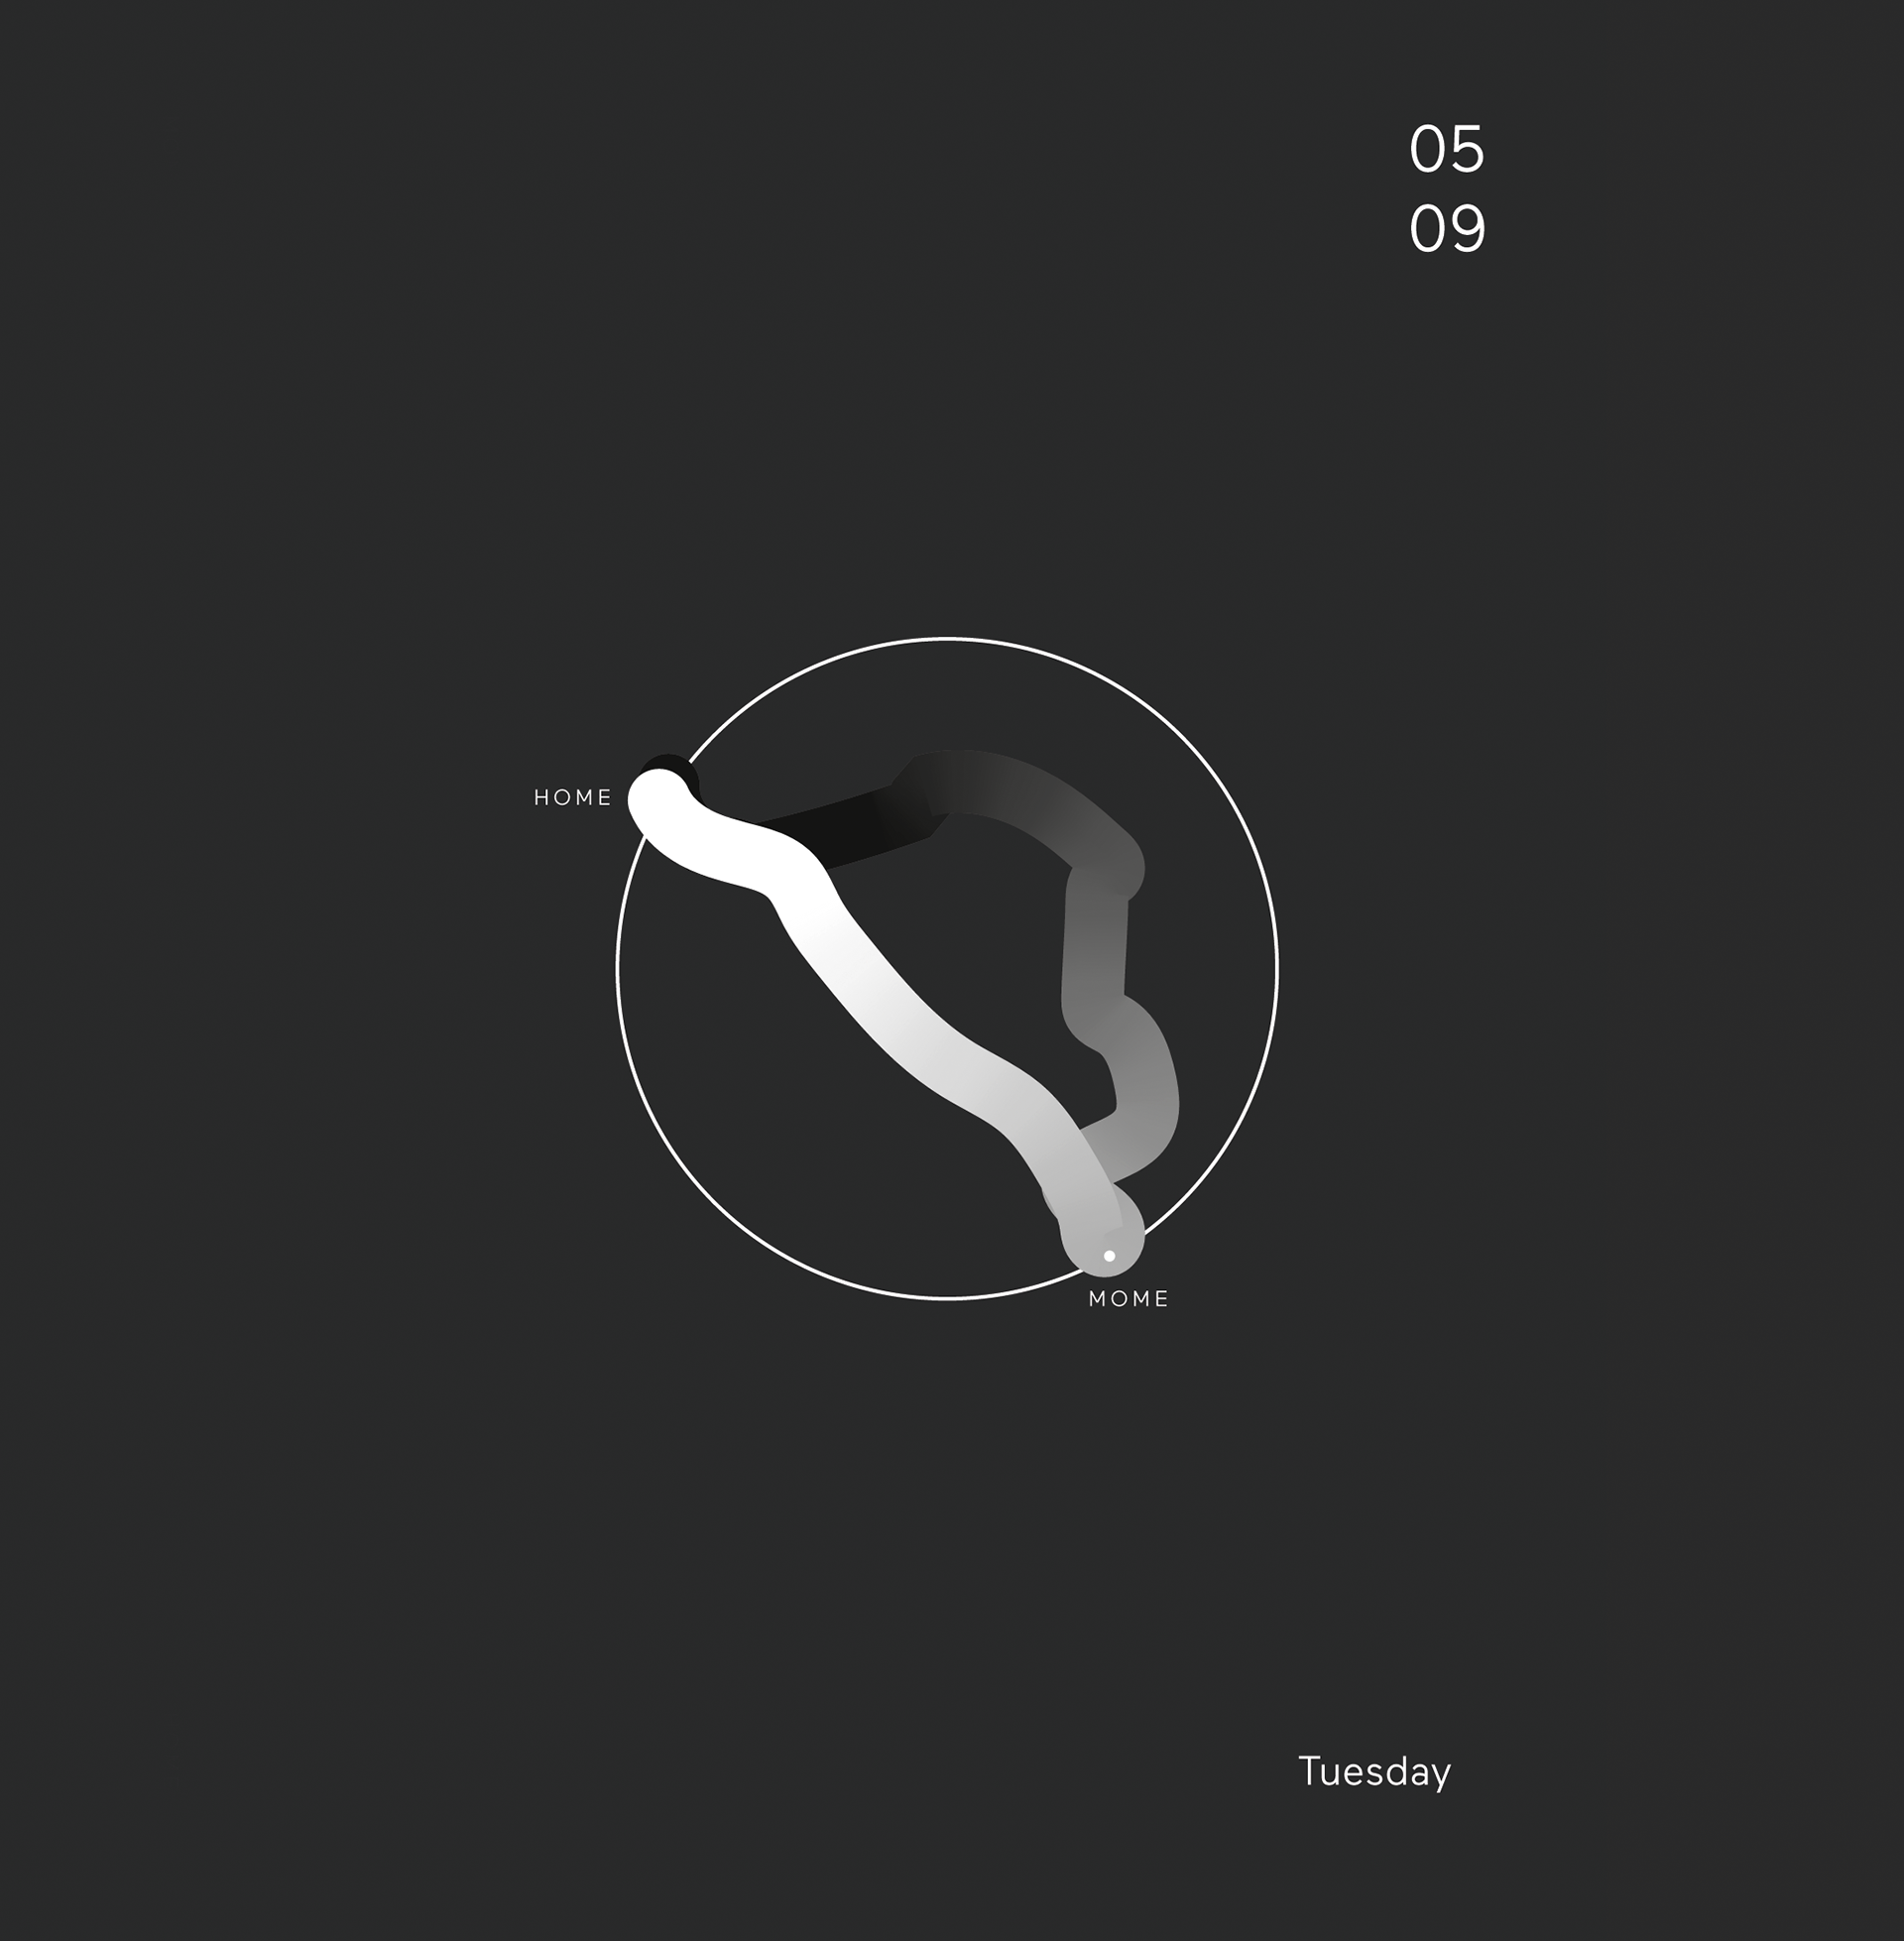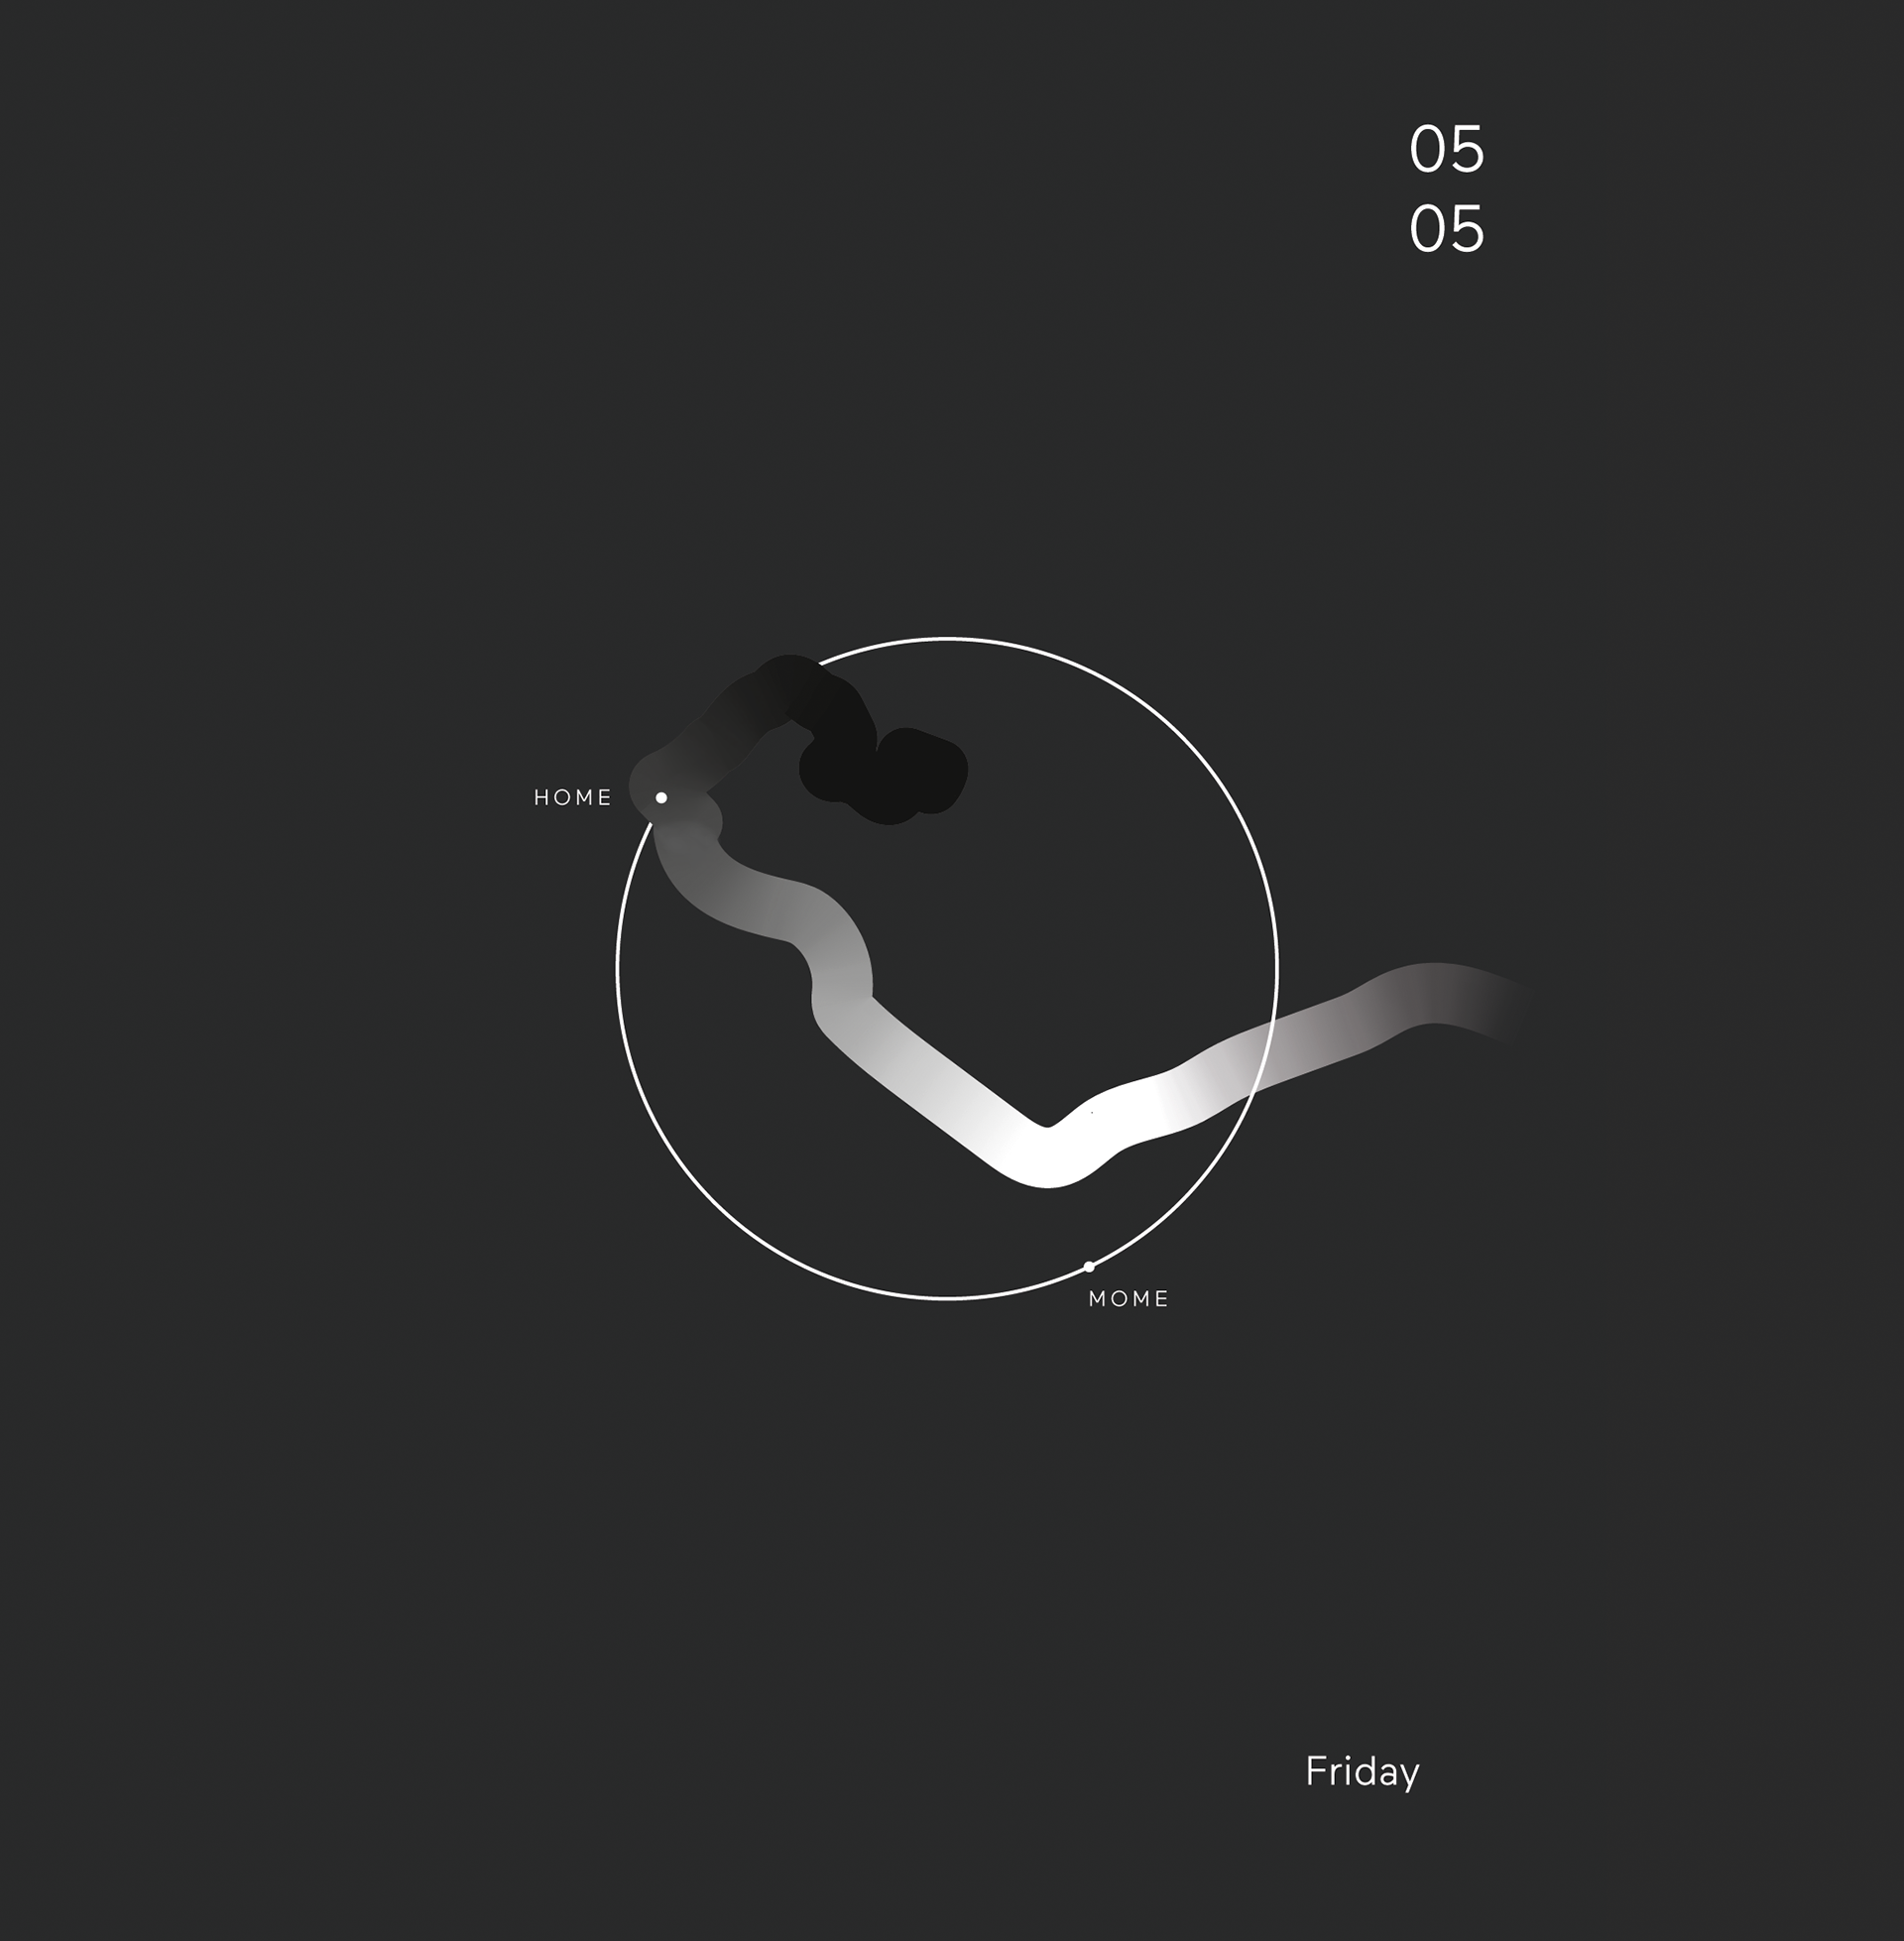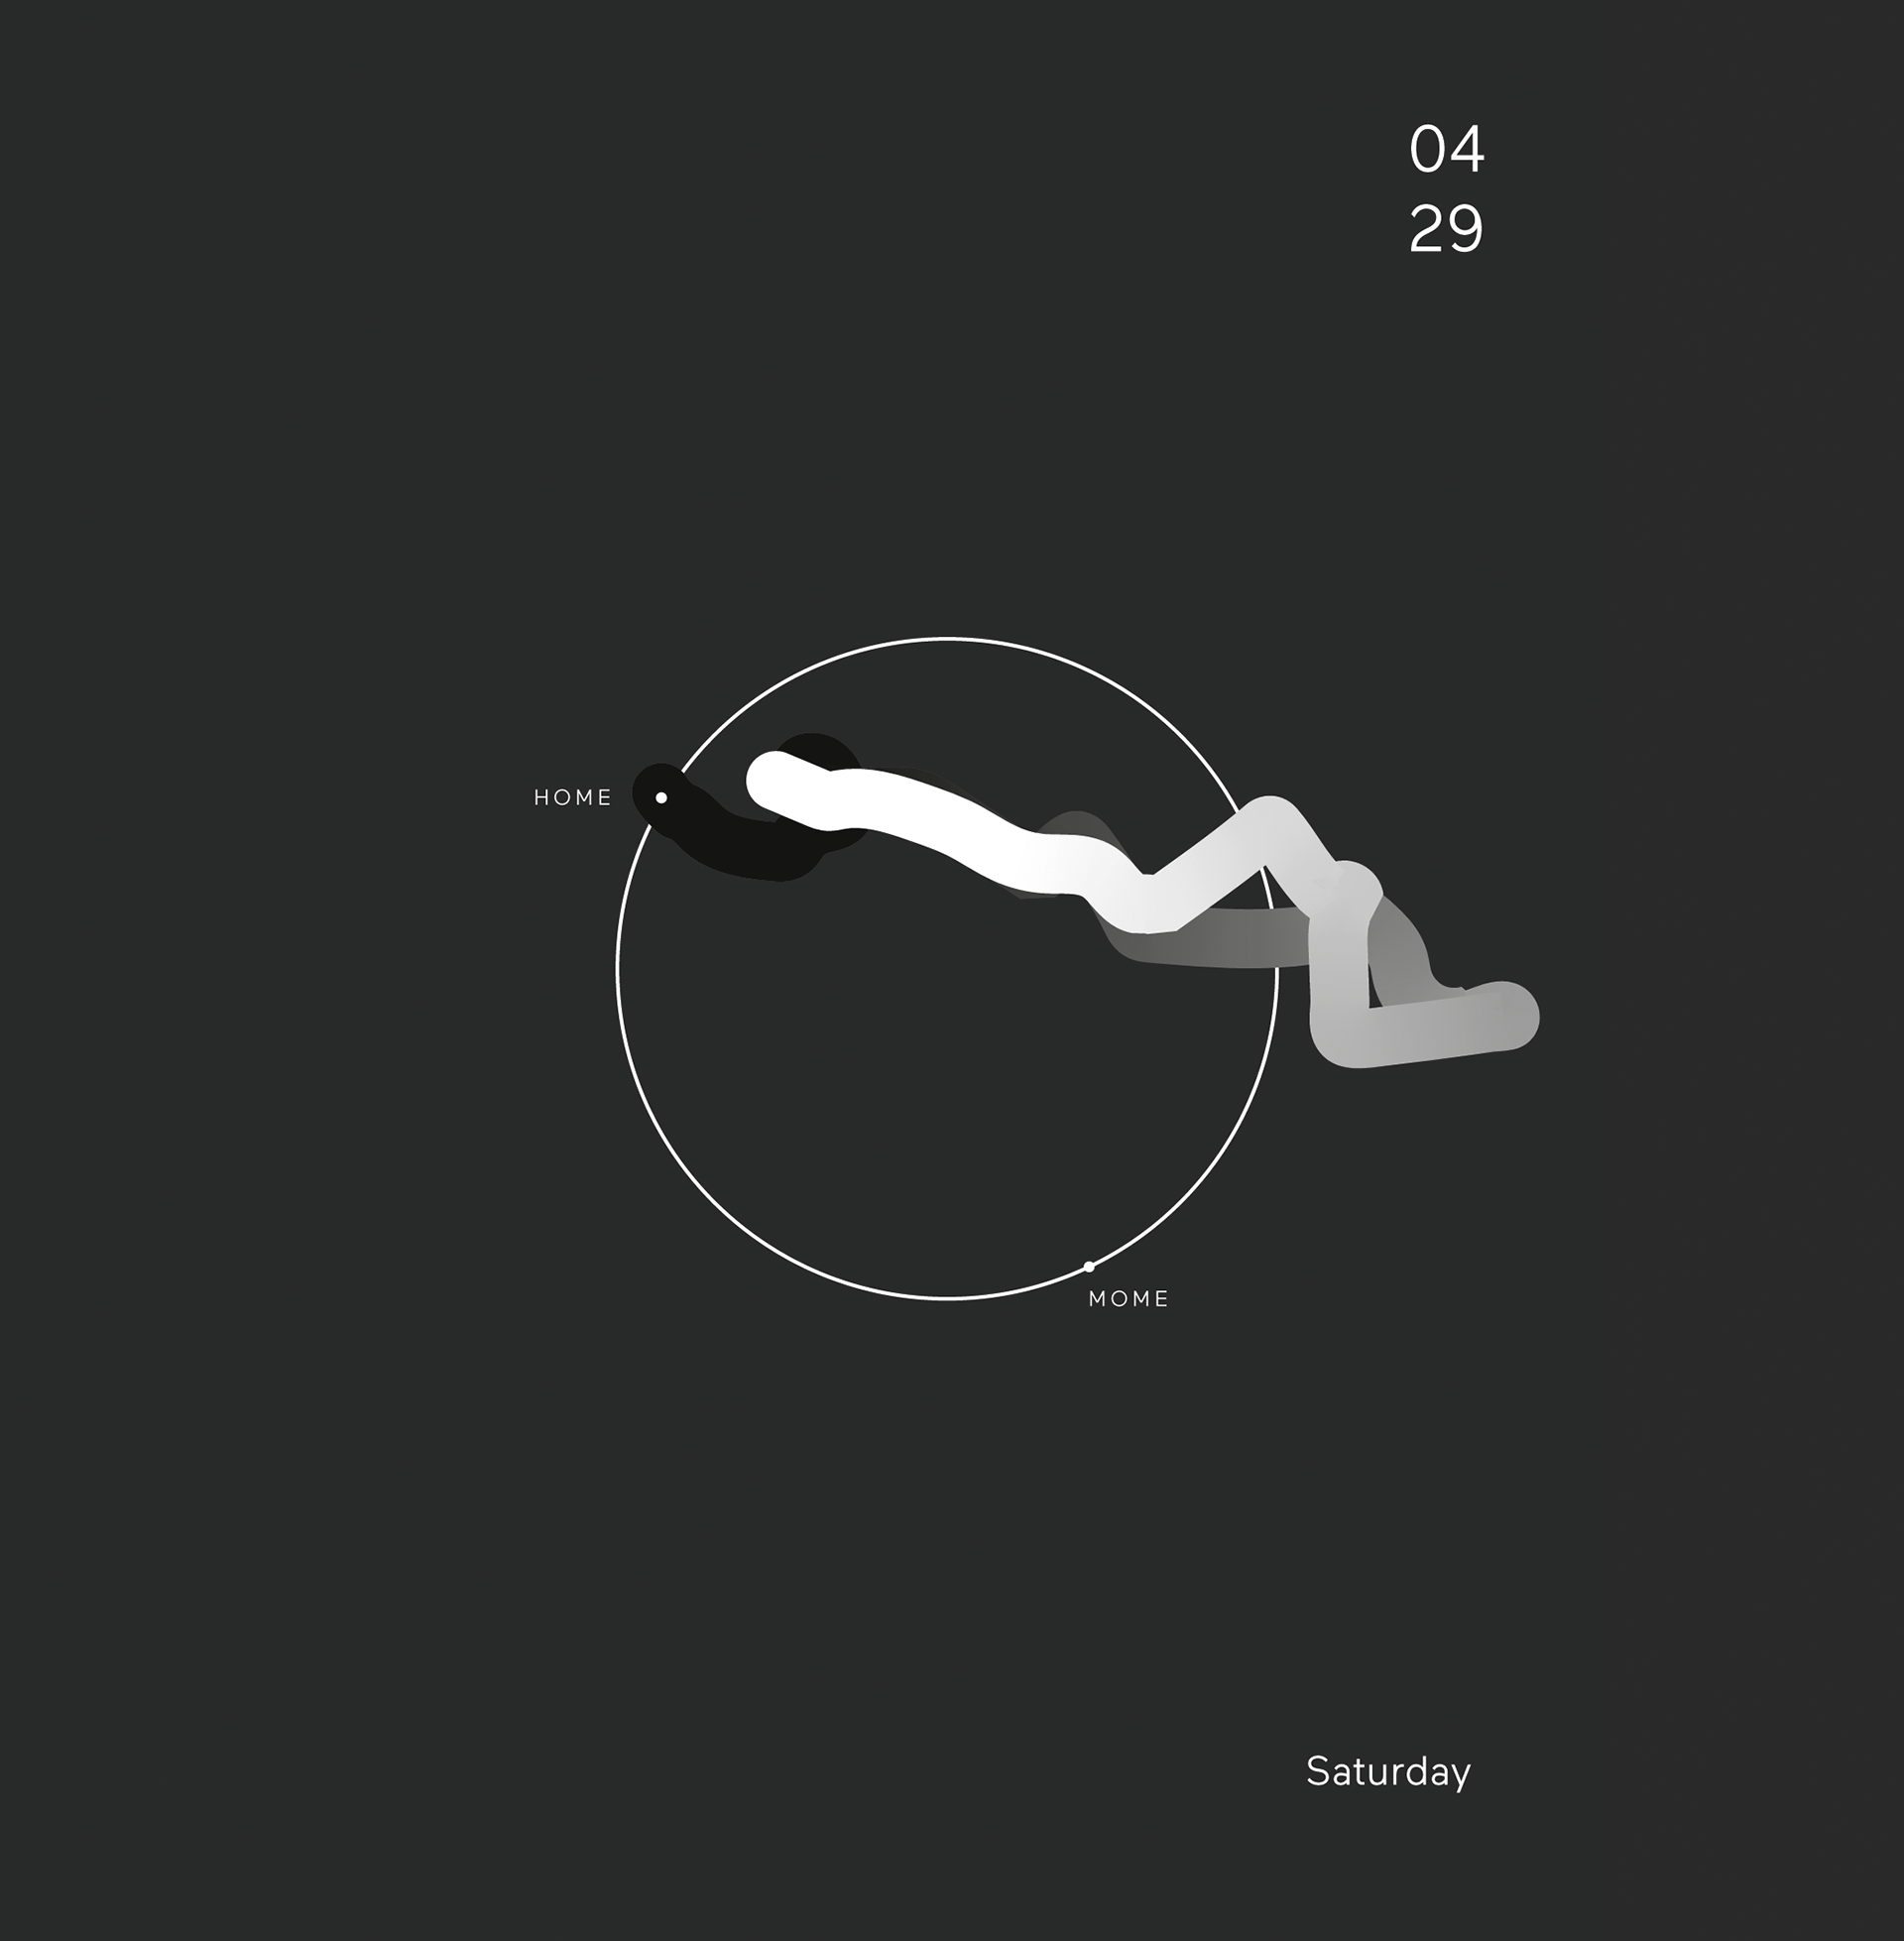

Moov is a datavisualization project and a basis of an application concept in which I visualized my daily
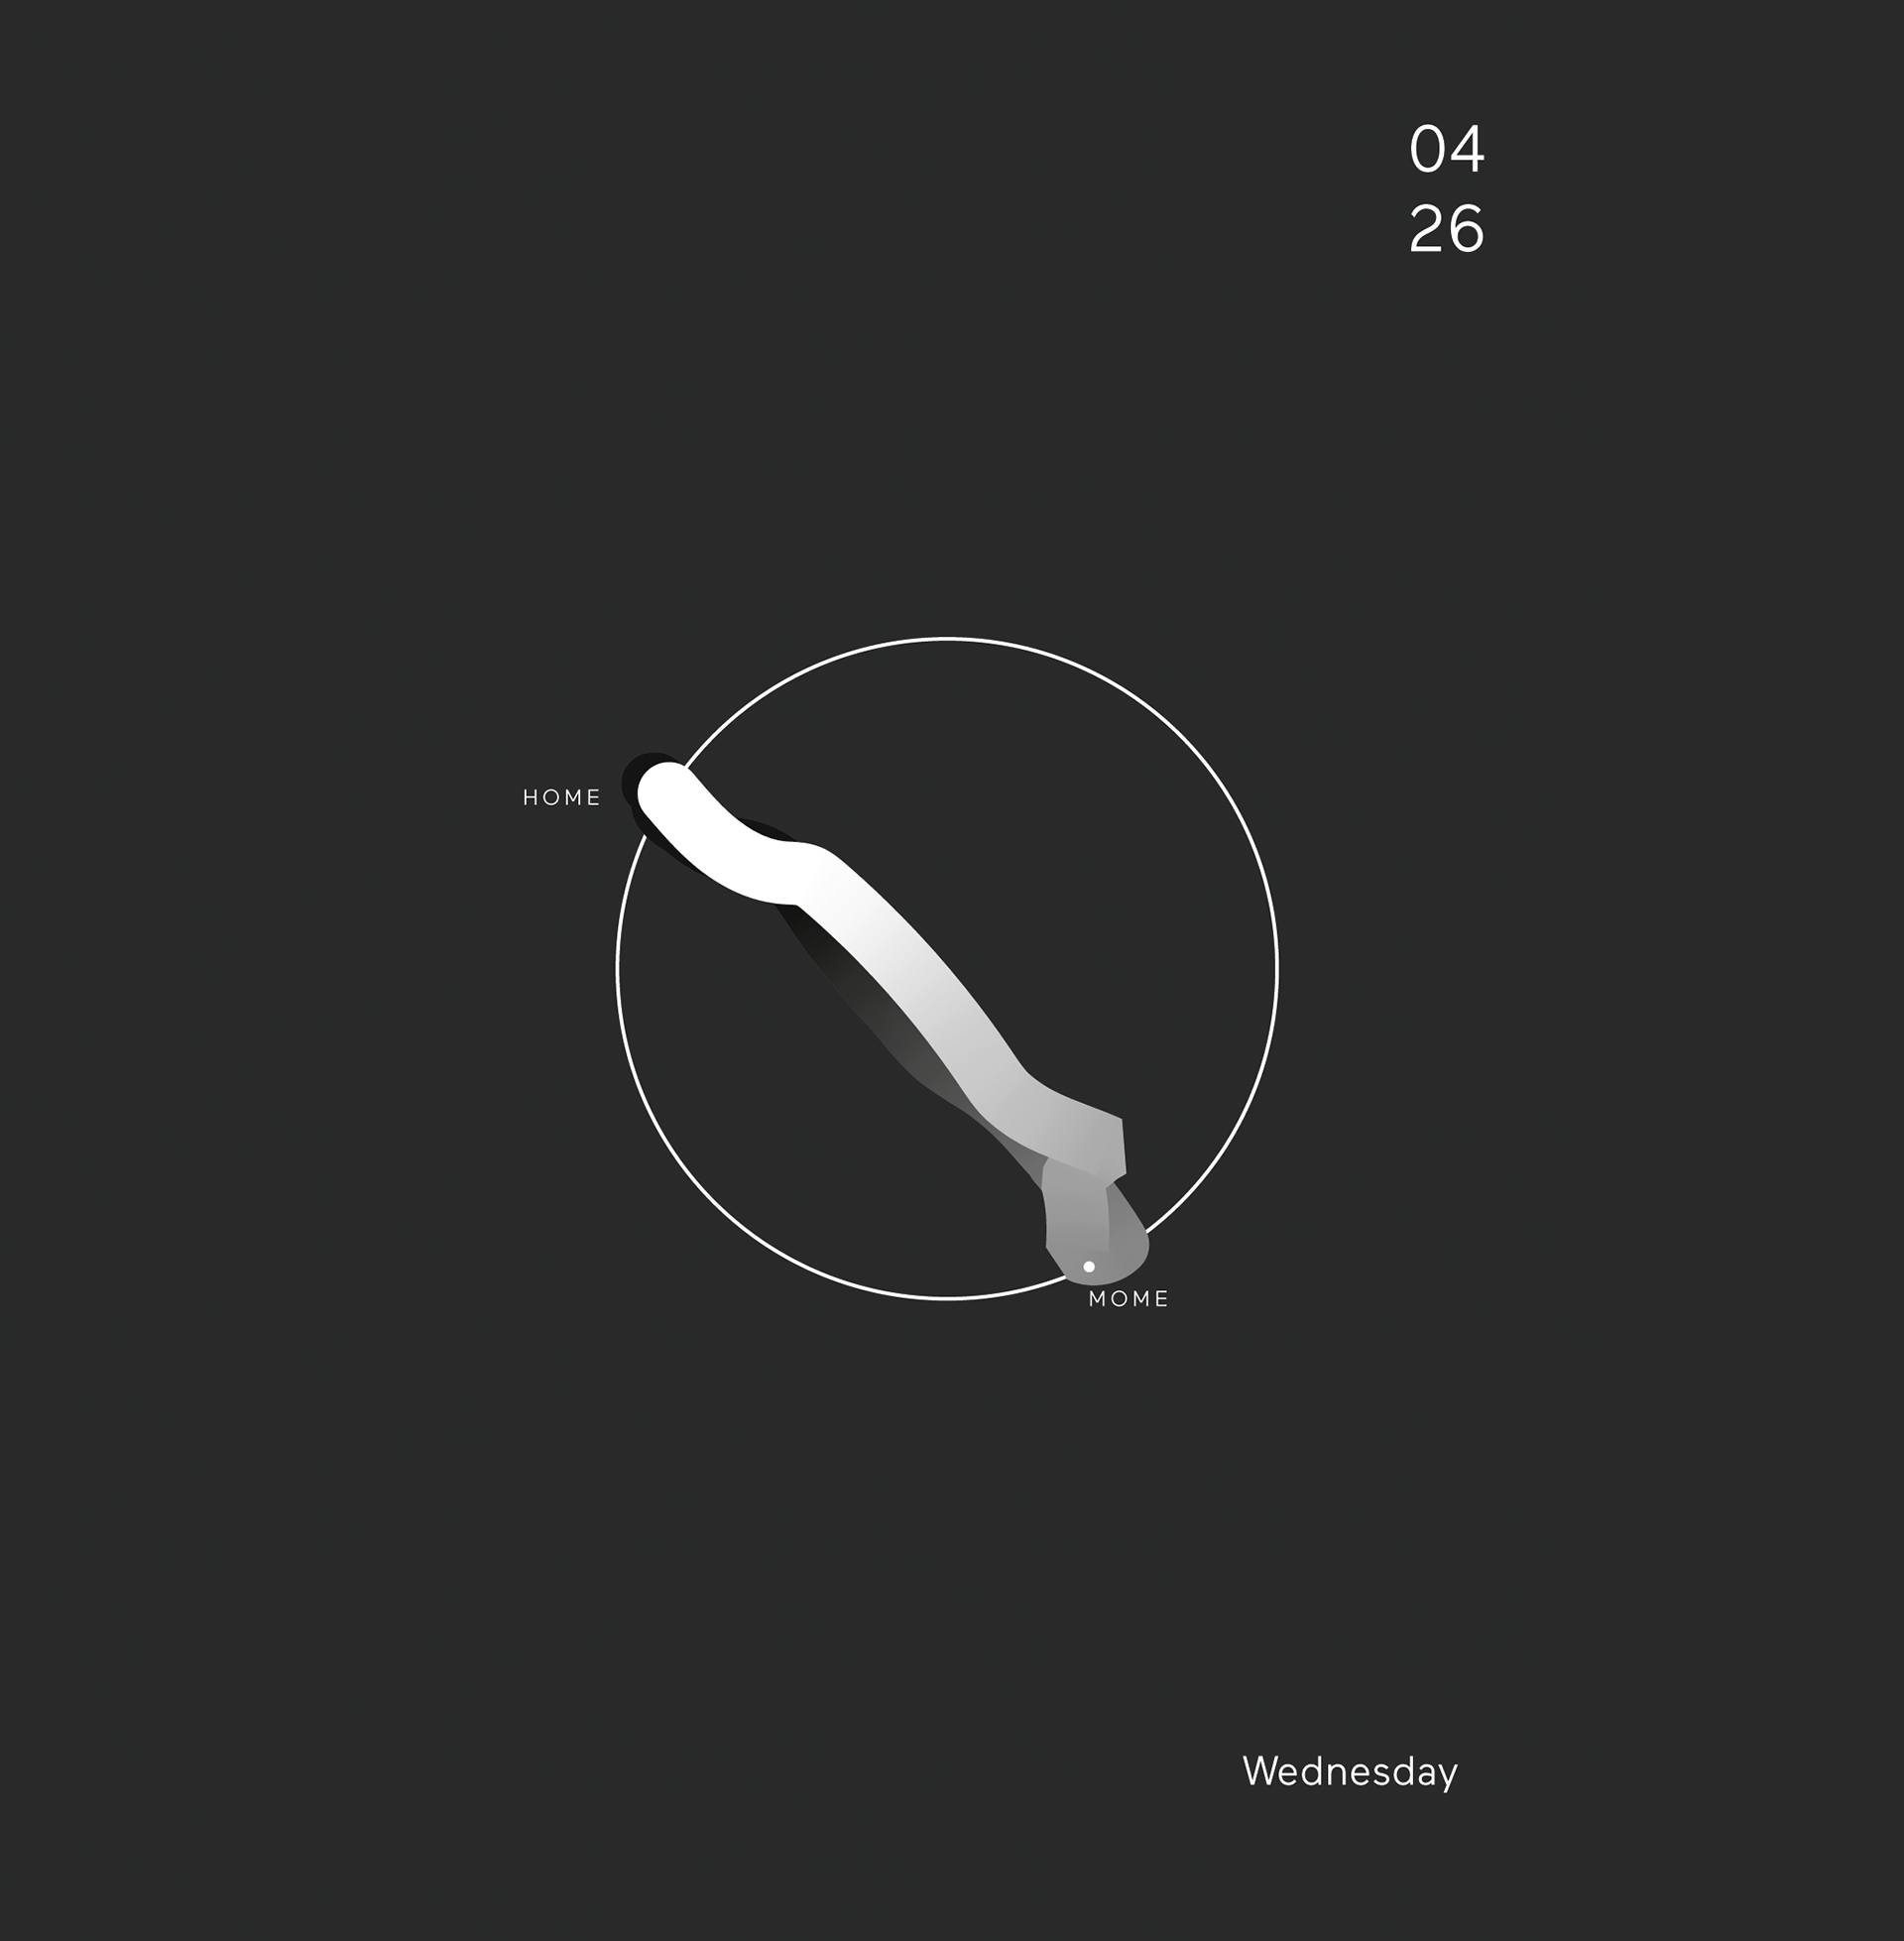
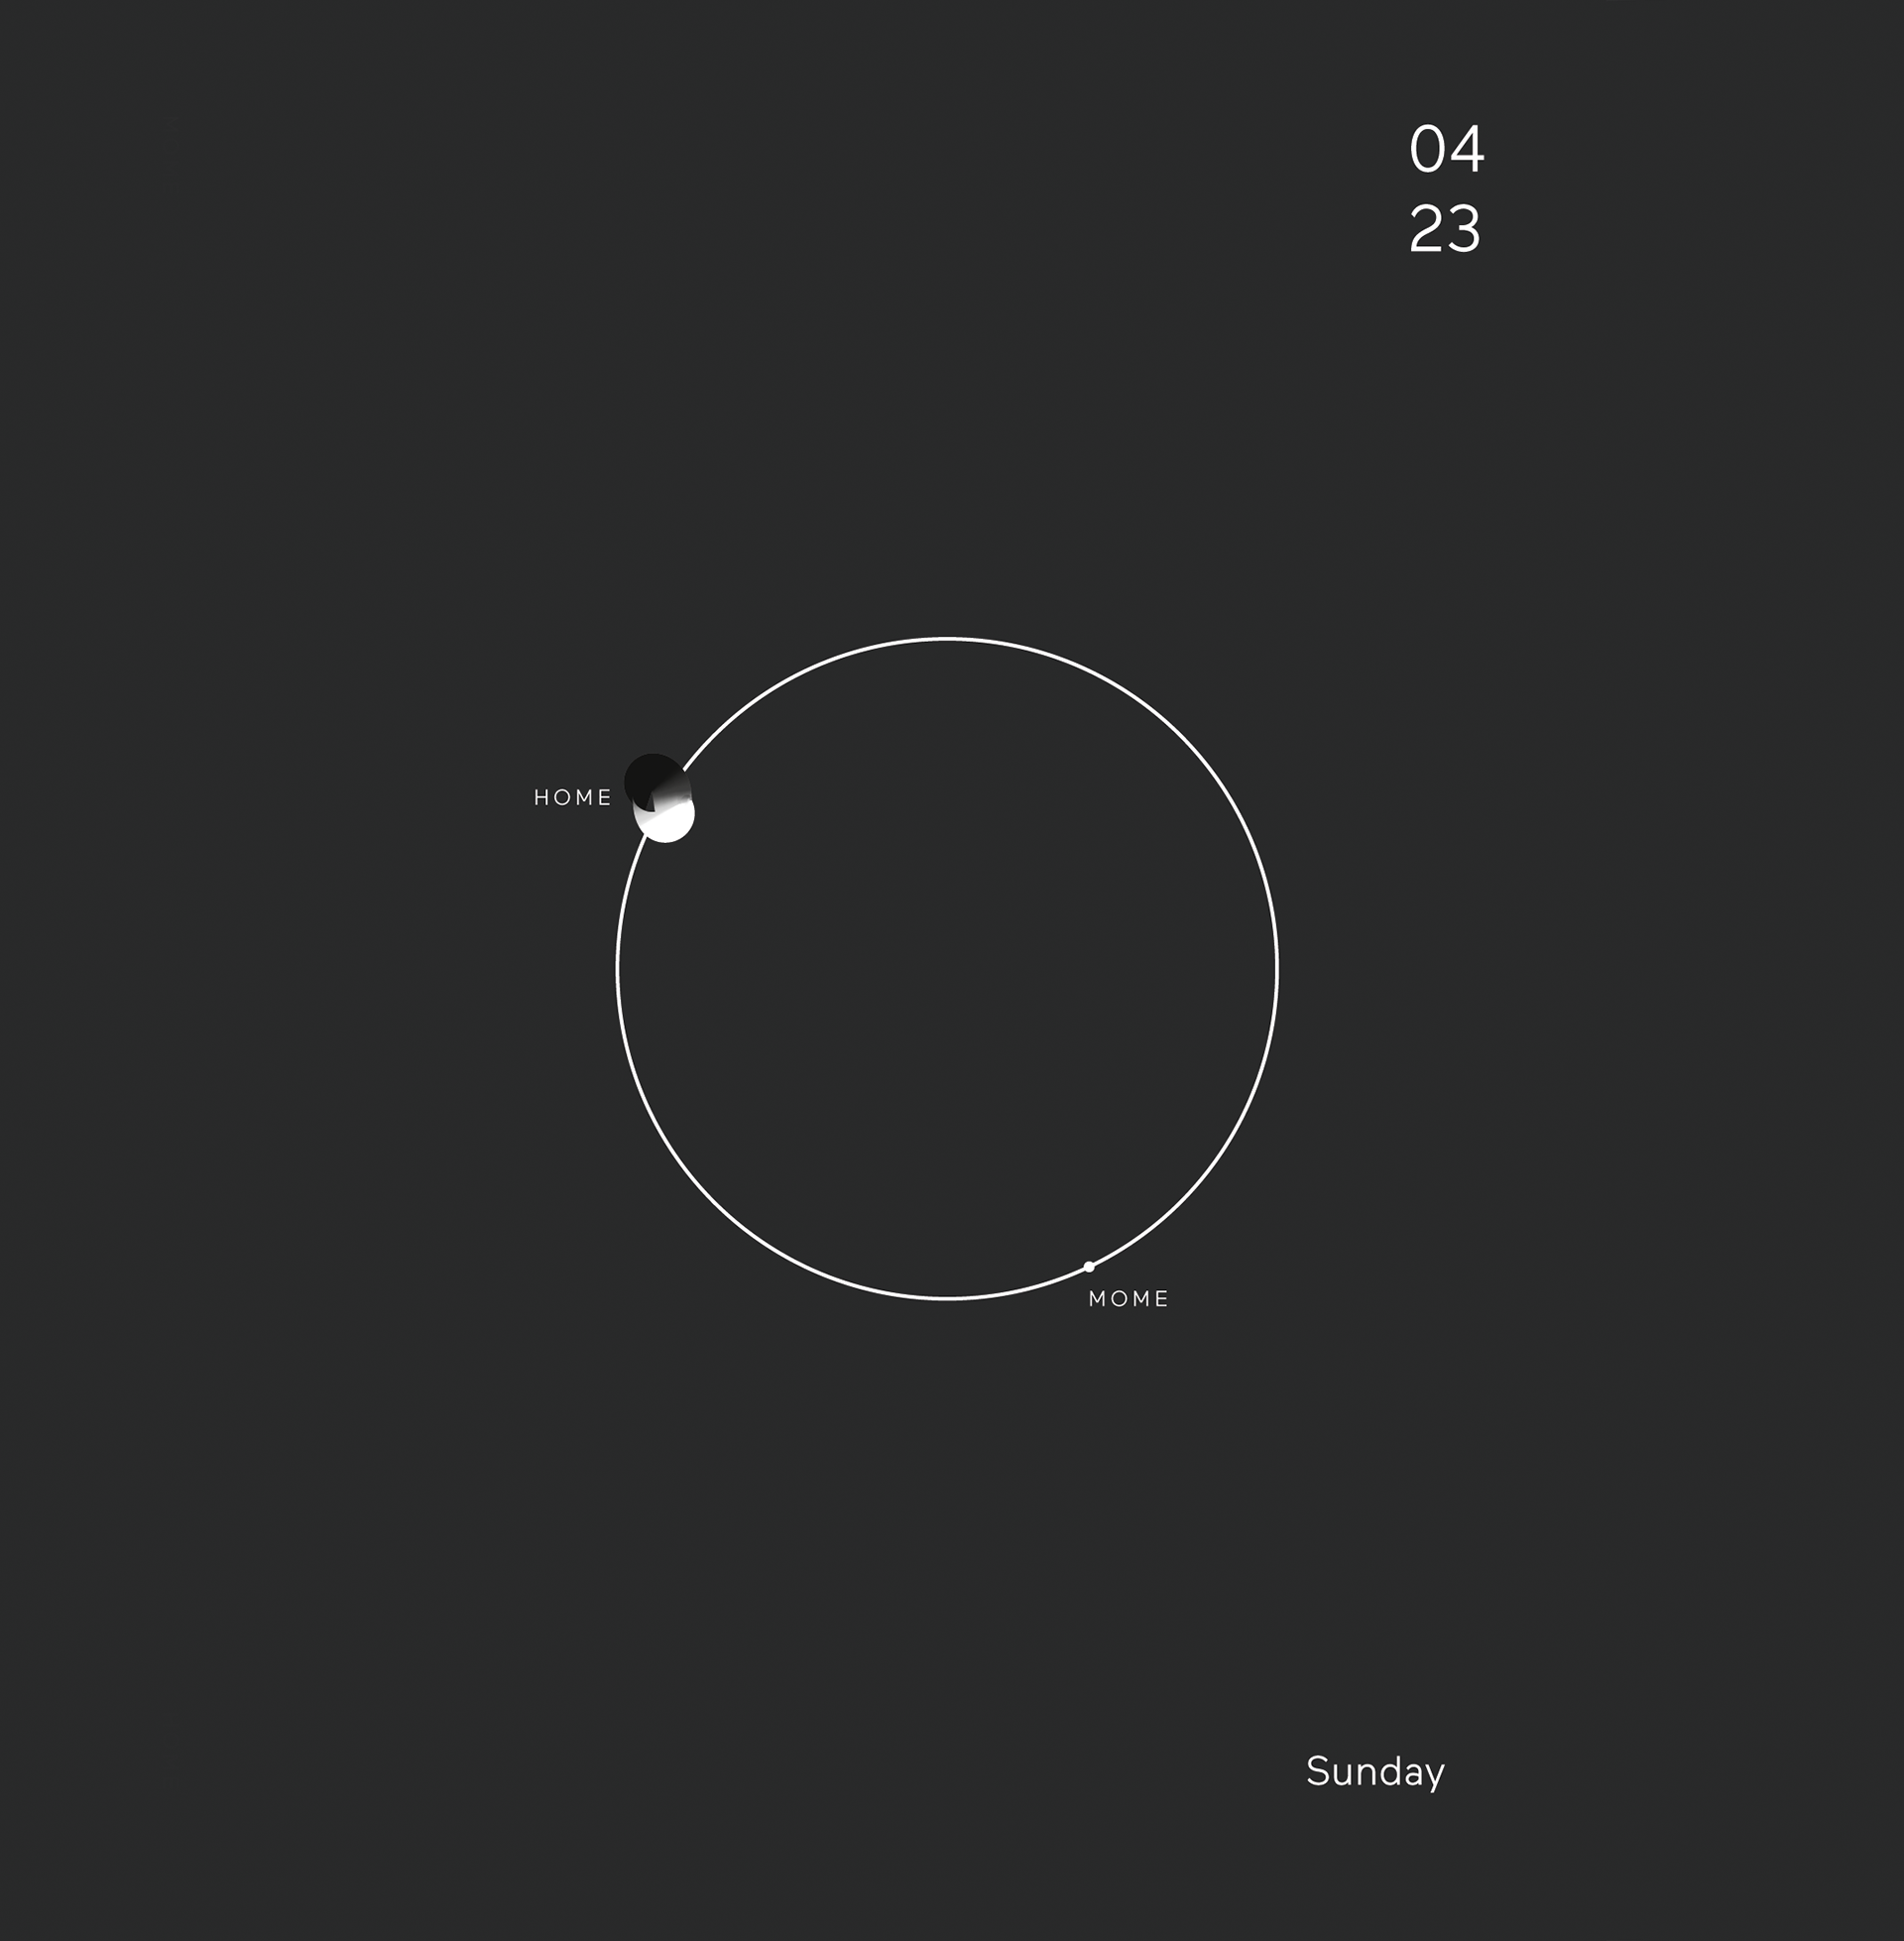
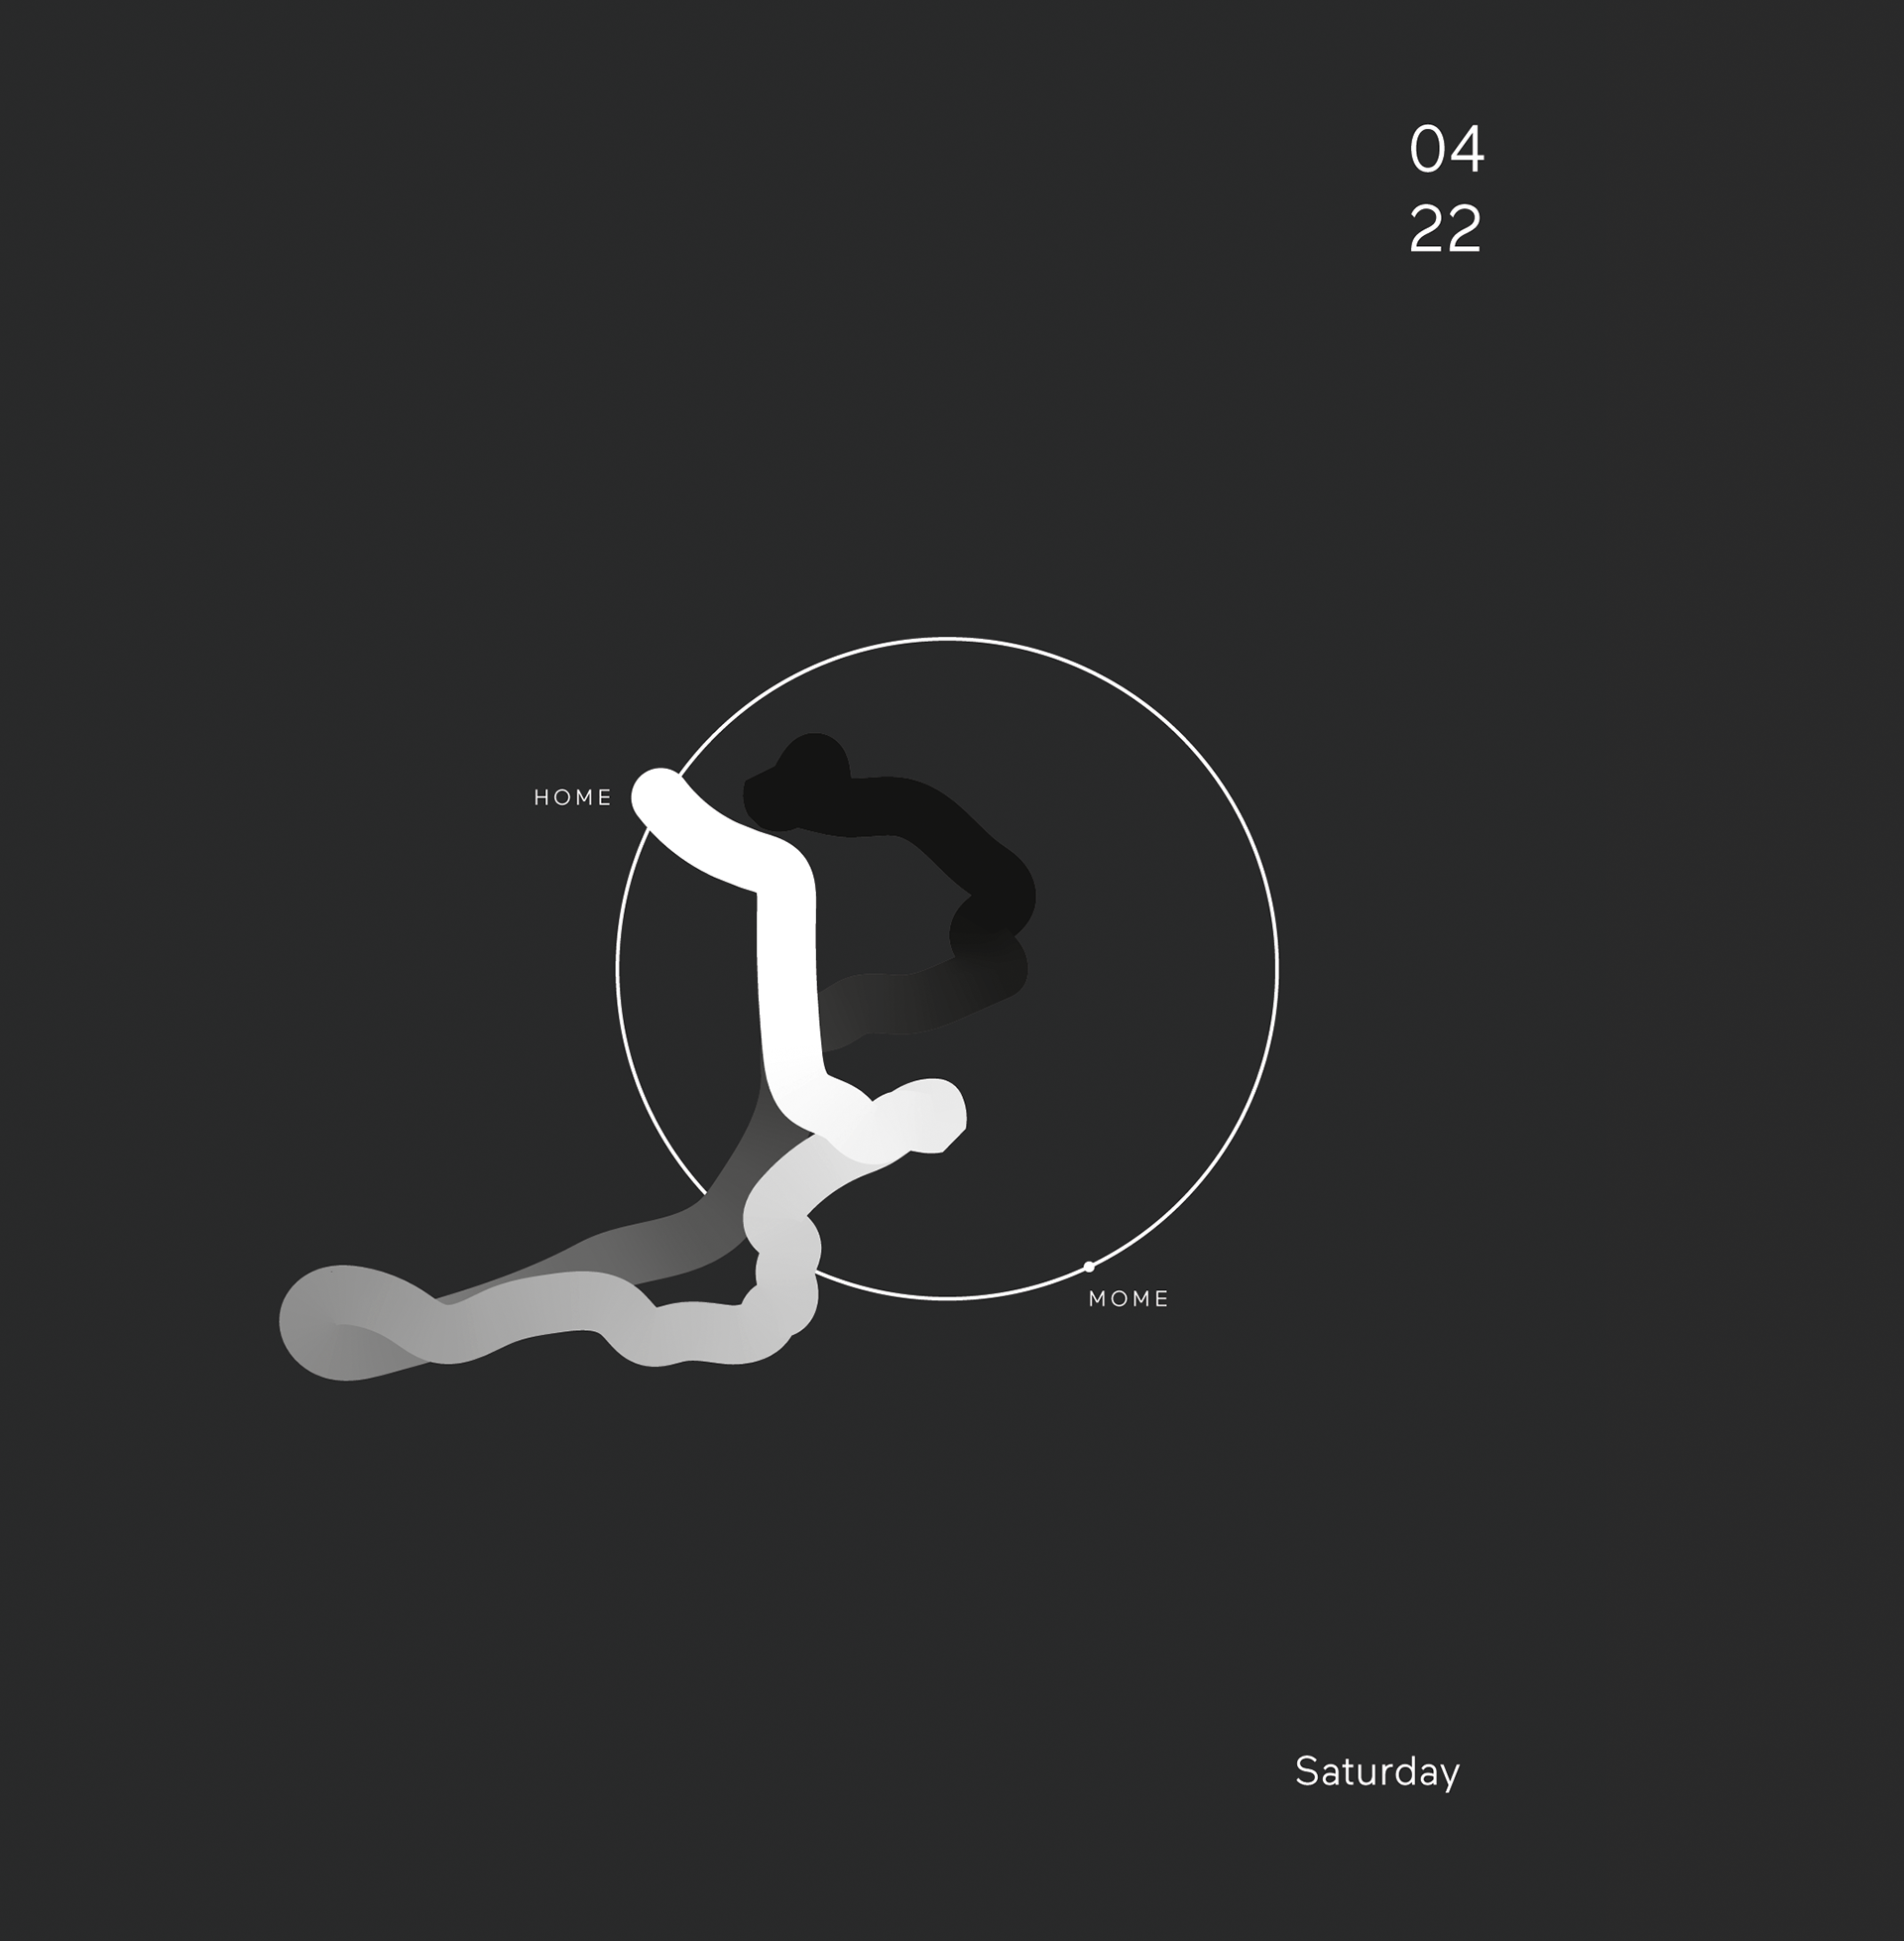
movement for a month. Since I spent most of my time in two different places then (at home or university), I illustrated my movement compared to these two points. In order to clarify the passage of time, a gradient line represents the time factor where black indicates the beginning of the day and white is the end of the day.
movement for a month. Since I spent most of my time in two different places then (at home or university), I illustrated my movement compared to these two points. In order to clarify the passage of time, a gradient line represents the time factor where black indicates the beginning of the day and white is the end of the day.